
Custom Reports lets you build your own reports from the custom events of your bot. You set them up here and see the results in Analytics → Custom Reports. See Operations reports.
Create a report
- Go to Tools in the left-hand menu of your bot and open Custom Reports. The counter at the top shows how many reports you have out of your limit.
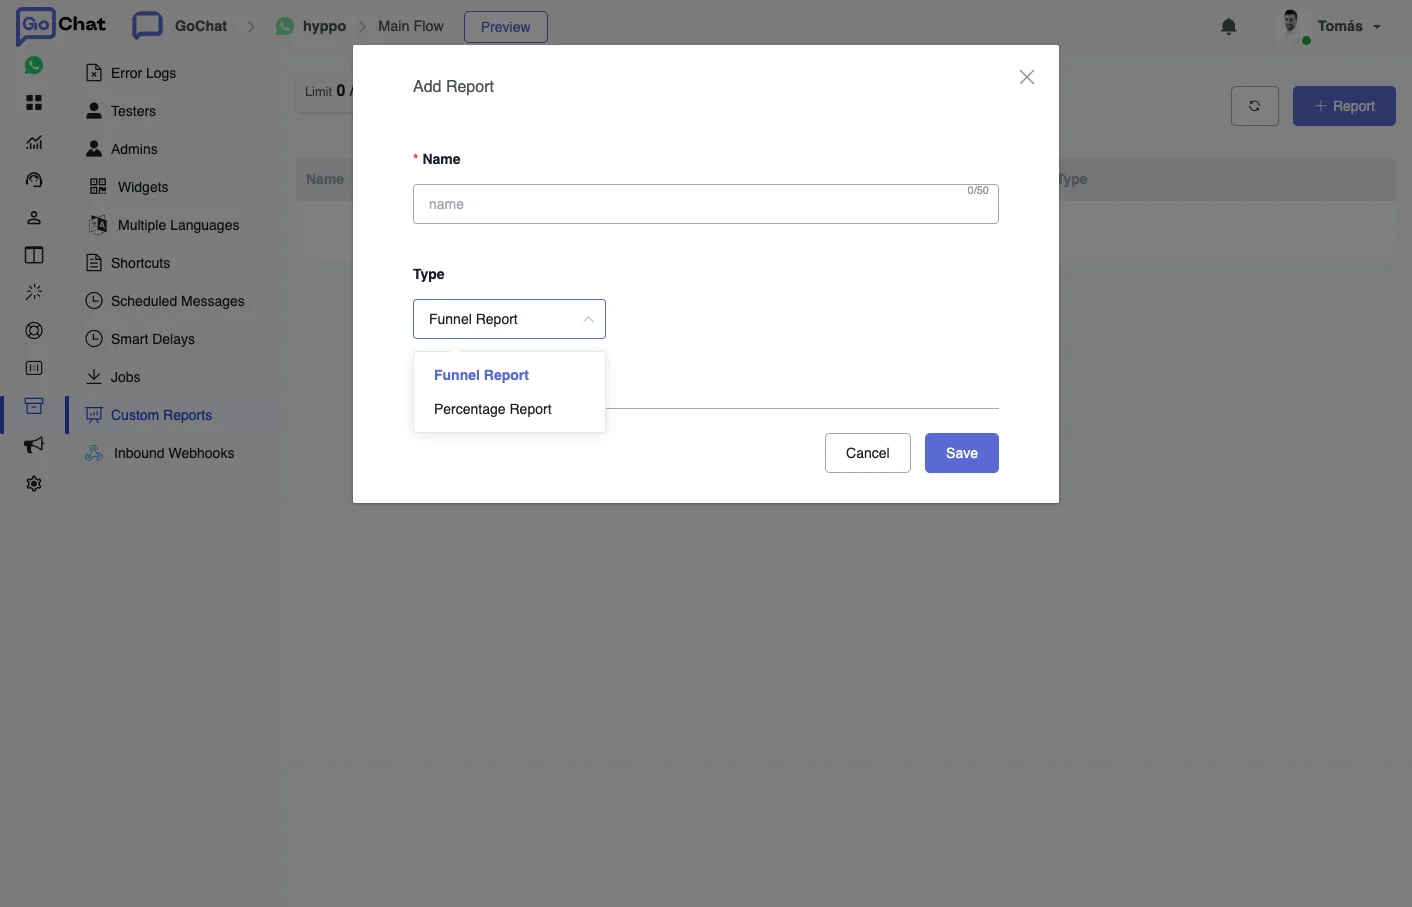
- Click + Report.
- Enter the Name (up to 50 characters) and choose the Type: Funnel Report or Percentage Report.
- Click Save, then click the gear icon of the report to set it up.
Funnel Report
A funnel report follows users through a series of events.
- Click Funnel Steps and then Add step.
- Choose the event you want to track.
- Click the three dots of the step to set it up, and click Done.
- Add more steps to compare several events.
With the palette icon at the top left you can change the colors of the charts. You can also edit their labels and axes, and choose which charts show up in the report.
Percentage Report
A percentage report compares two events. Choose them in Field A and Field B, and pick a formula:
- Formula 1: Field A as a percentage of Field B. For example, the sales of one product out of all sales.
- Formula 2: Field A as a percentage of the sum of both. Useful for A/B tests, for example how many users went through flow A and how many through flow B.
- Formulas 3 and 4: values that are not a direct ratio. For example, the real response rate of an SMS campaign when some of the replies are opt-outs.